Key messages
- 2025 marked the ninth consecutive record year for ocean heat content (OHC). Warming has accelerated markedly over the past six decades and is now more widespread, with about a third of the global ocean reaching its top-three warmest levels last year.
- Since the ocean absorbs over 90% of excess heat from the Earth’s growing energy imbalance, OHC is one of the most reliable indicators of how much extra energy is accumulating in the climate system.
- Near-term warming is partly “locked in” by ocean heat already accumulated. Because heat takes decades to penetrate ocean depths, today’s energy imbalance will keep shaping the climate for decades to come. Cutting emissions now can still prevent additional, potentially irreversible warming.
- Clouds, aerosols, and climate sensitivity add uncertainty to where and how warming plays out. Some models with lower climate sensitivity fail to reproduce observed energy imbalance trends, suggesting actual greenhouse-gas-driven warming could be stronger than most current simulations project.
The Earth is warming, but where exactly is that excess heat ending up? Several key indicators suggest that the world may already be on an accelerated warming pathway, highlighting the urgent need to decarbonise and prepare for impacts already set in motion. At the same time, geophysical components require further investigation to better understand how warming could manifest in the coming decades.
Earth’s energy imbalance (EEI) is arguably the ultimate measuring stick of global warming. It is the difference between the radiation arriving from the Sun and the energy reflected or radiated back into space. By tracking EEI, scientists can quantify the effects of natural and human-caused warming and cooling, as well as feedback processes. Changes in EEI are estimated from radiometric measurements at the top of the atmosphere, while its absolute magnitude is quantified by summing the heat accumulated across the ocean, land, ice, and atmosphere.
More than 90% of the excess heat is absorbed by the oceans, but the specific geophysical connections between EEI and rising OHC are challenging to disentangle. Data spanning the past six decades reveal that OHC has risen with EEI, even though the signal has been complicated by natural variability since 2005, including El Niño. Figure 1 shows the marked rise in global OHC since the 1990s, reaching a record high in 2025. Heat takes about 25 years to penetrate the ocean column, from the surface down to 2,000 m, so additional warming at depth is already committed.
The latest figures are stark: 2025 saw the ninth consecutive record year for OHC, and about a third of the global ocean ranked among its three warmest states on record. From 2005 to 2025, the mean ocean warming rate increased markedly, reaching 0.32 ± 0.12 W/m² per decade, which is broadly consistent with the 0.47 ± 0.22 W/m² per decade rate measured by satellites over the same period. Warming extends from the surface into the deep ocean, though its magnitude varies by depth and region, with the strongest warming occurring in a band near 30–45° latitude in both hemispheres. This suggests that the distribution of heat is shaped by ocean and atmospheric flows, which in turn are influenced by natural variability, including events such as the El Niño–Southern Oscillation.
Across the Earth system, several feedbacks are at play. Radiative cooling is a strong negative feedback because, as the planet warms, it radiates more heat into space, thereby partly offsetting further warming. Water vapour works the other way: a warmer atmosphere can hold up to about 7% more per degree Celsius of warming, and since water vapour is itself a greenhouse gas, this amplifies the initial warming. Melting snow and ice add another positive feedback, since the darker ocean and land surfaces left behind absorb more sunlight than the bright, reflective ice they replace. Atmospheric aerosols cut both ways: soot particles absorb heat, while lighter-coloured sulphate particles reflect sunlight and cool the planet. Some studies suggest their cooling effect has weakened in the past two decades, meaning that measures to cut air pollution may have slightly accelerated warming, though the size of this effect remains debated.
The role clouds will play in a warming world remains unclear, and cloud feedbacks are among the largest sources of uncertainty in climate projections. Recent research suggests that cloud cover, particularly over the ocean, has been declining as temperatures rise, meaning less sunlight is reflected back to space, further contributing to the warming trend. The record heat of 2023–2024 coincided with a strong El Niño, consistent with a pattern of global warming jumping to new levels during such events. However, because climate models do not reproduce observed clouds and rainfall very well, the specific contribution of clouds to this warming remains an open question.
Human-induced warming also strengthens atmospheric convection, making it narrower and taller while widening the regions of sinking air in the subtropics. When first described around the turn of the millennium, this “iris” effect was proposed as a negative feedback effect, since it allows more heat to escape into space from the warmer surface below. But subsequent research highlights that this view overlooks the fact that fewer clouds outside these narrower convection zones let in more sunlight, more than offsetting this effect. This is a non-local positive feedback.
EEI observations have been collected since March 2000 by CERES, a set of NASA satellite instruments that measure the sunlight reflected and heat radiated by Earth. EEI is too small to measure accurately in absolute terms, but because the instruments are far more stable than they are accurate, changes over time can be tracked reliably. Although short-term noise in the data is considerable, averaging it out over time reveals a clear, steady heating signal that has been compared directly with OHC.
Another tool that can help improve the accuracy of EEI measurement is “reanalysis”, which combines models with observations to reconstruct past weather and climate. ERA5, a widely used dataset, improves on previous versions, though errors in how models represent clouds and rainfall still affect EEI estimates. Recent work suggests models with lower climate sensitivity fail to reproduce observed EEI trends, hinting that greenhouse gases may be driving more warming than most current models predict. These findings underscore the importance of sustained monitoring efforts such as the Global Ocean Observing System, an international network that tracks ocean temperature, currents, and other properties worldwide.
Policy implications
- Accelerate nationally determined contributions (NDCs) implementation while preparing for long-term ocean change. Accelerating EEI and ocean heat uptake reinforce the need for immediate, deep, and sustained greenhouse-gas reductions. Parties should fully implement and, where possible, strengthen their 2035 NDCs and align long-term low-emission development strategies with pathways with limited overshoot of 1.5°C warming (see Insight 4). At the same time, the recognition of committed and potentially intensifying ocean changes should be reflected in National Adaptation Plans (NAPs), long-term investment decisions, and risk assessments, prioritising vulnerable coastal and marine-dependent communities. Because ocean heat penetrates progressively into deeper layers and some associated changes persist for centuries, choices made this decade will influence ocean and climate risks far into the future.
- Integrate ocean action across the UNFCCC. Building on COP30 ocean initiatives, including the Blue NDC Challenge and the 2026 Ocean and Climate Change Dialogue, the ocean–climate nexus should become a cross-cutting component of UNFCCC governance. Key organising activities include:
- Establish systematic reporting and a multi-year ocean–climate roadmap, identifying entry points across NDCs, the GST2, and other Paris Agreement processes, to facilitate continuity across COP presidencies and enable assessment of collective progress.
- Mapping emerging ocean initiatives to identify gaps, implementation, and finance bottlenecks, and potential duplication, clarifying responsibilities and opportunities for collaboration.
- Sustain observing systems as critical infrastructure for climate action. Governments and relevant international institutions should provide predictable, long-term support for the satellite and in-situ systems underpinning measurements of EEI and OHC — including radiation-budget instruments such as CERES, Argo floats, and national and regional ocean-observing networks.
- Through the UNFCCC Research and Systematic Observation agenda, Parties should strengthen collaboration with WMO, GCOS, GOOS, UNESCO-IOC, and relevant space agencies to identify coverage and capacity gaps, and mobilise targeted support for vulnerable and under-observed regions.
- The resulting open, standardised, and sustained observations should inform the scientific inputs to the GST2, helping assess the climate system’s response to emissions and evaluate climate models. They should also be translated into regional climate services, forecasts, and early-warning information that support NAPs and other risk-management decisions.
- Given the importance of this data for coastal states’ adaptation planning, sustained funding and scientific cooperation for these programmes and systems is crucial and should be raised explicitly within adaptation discussions.
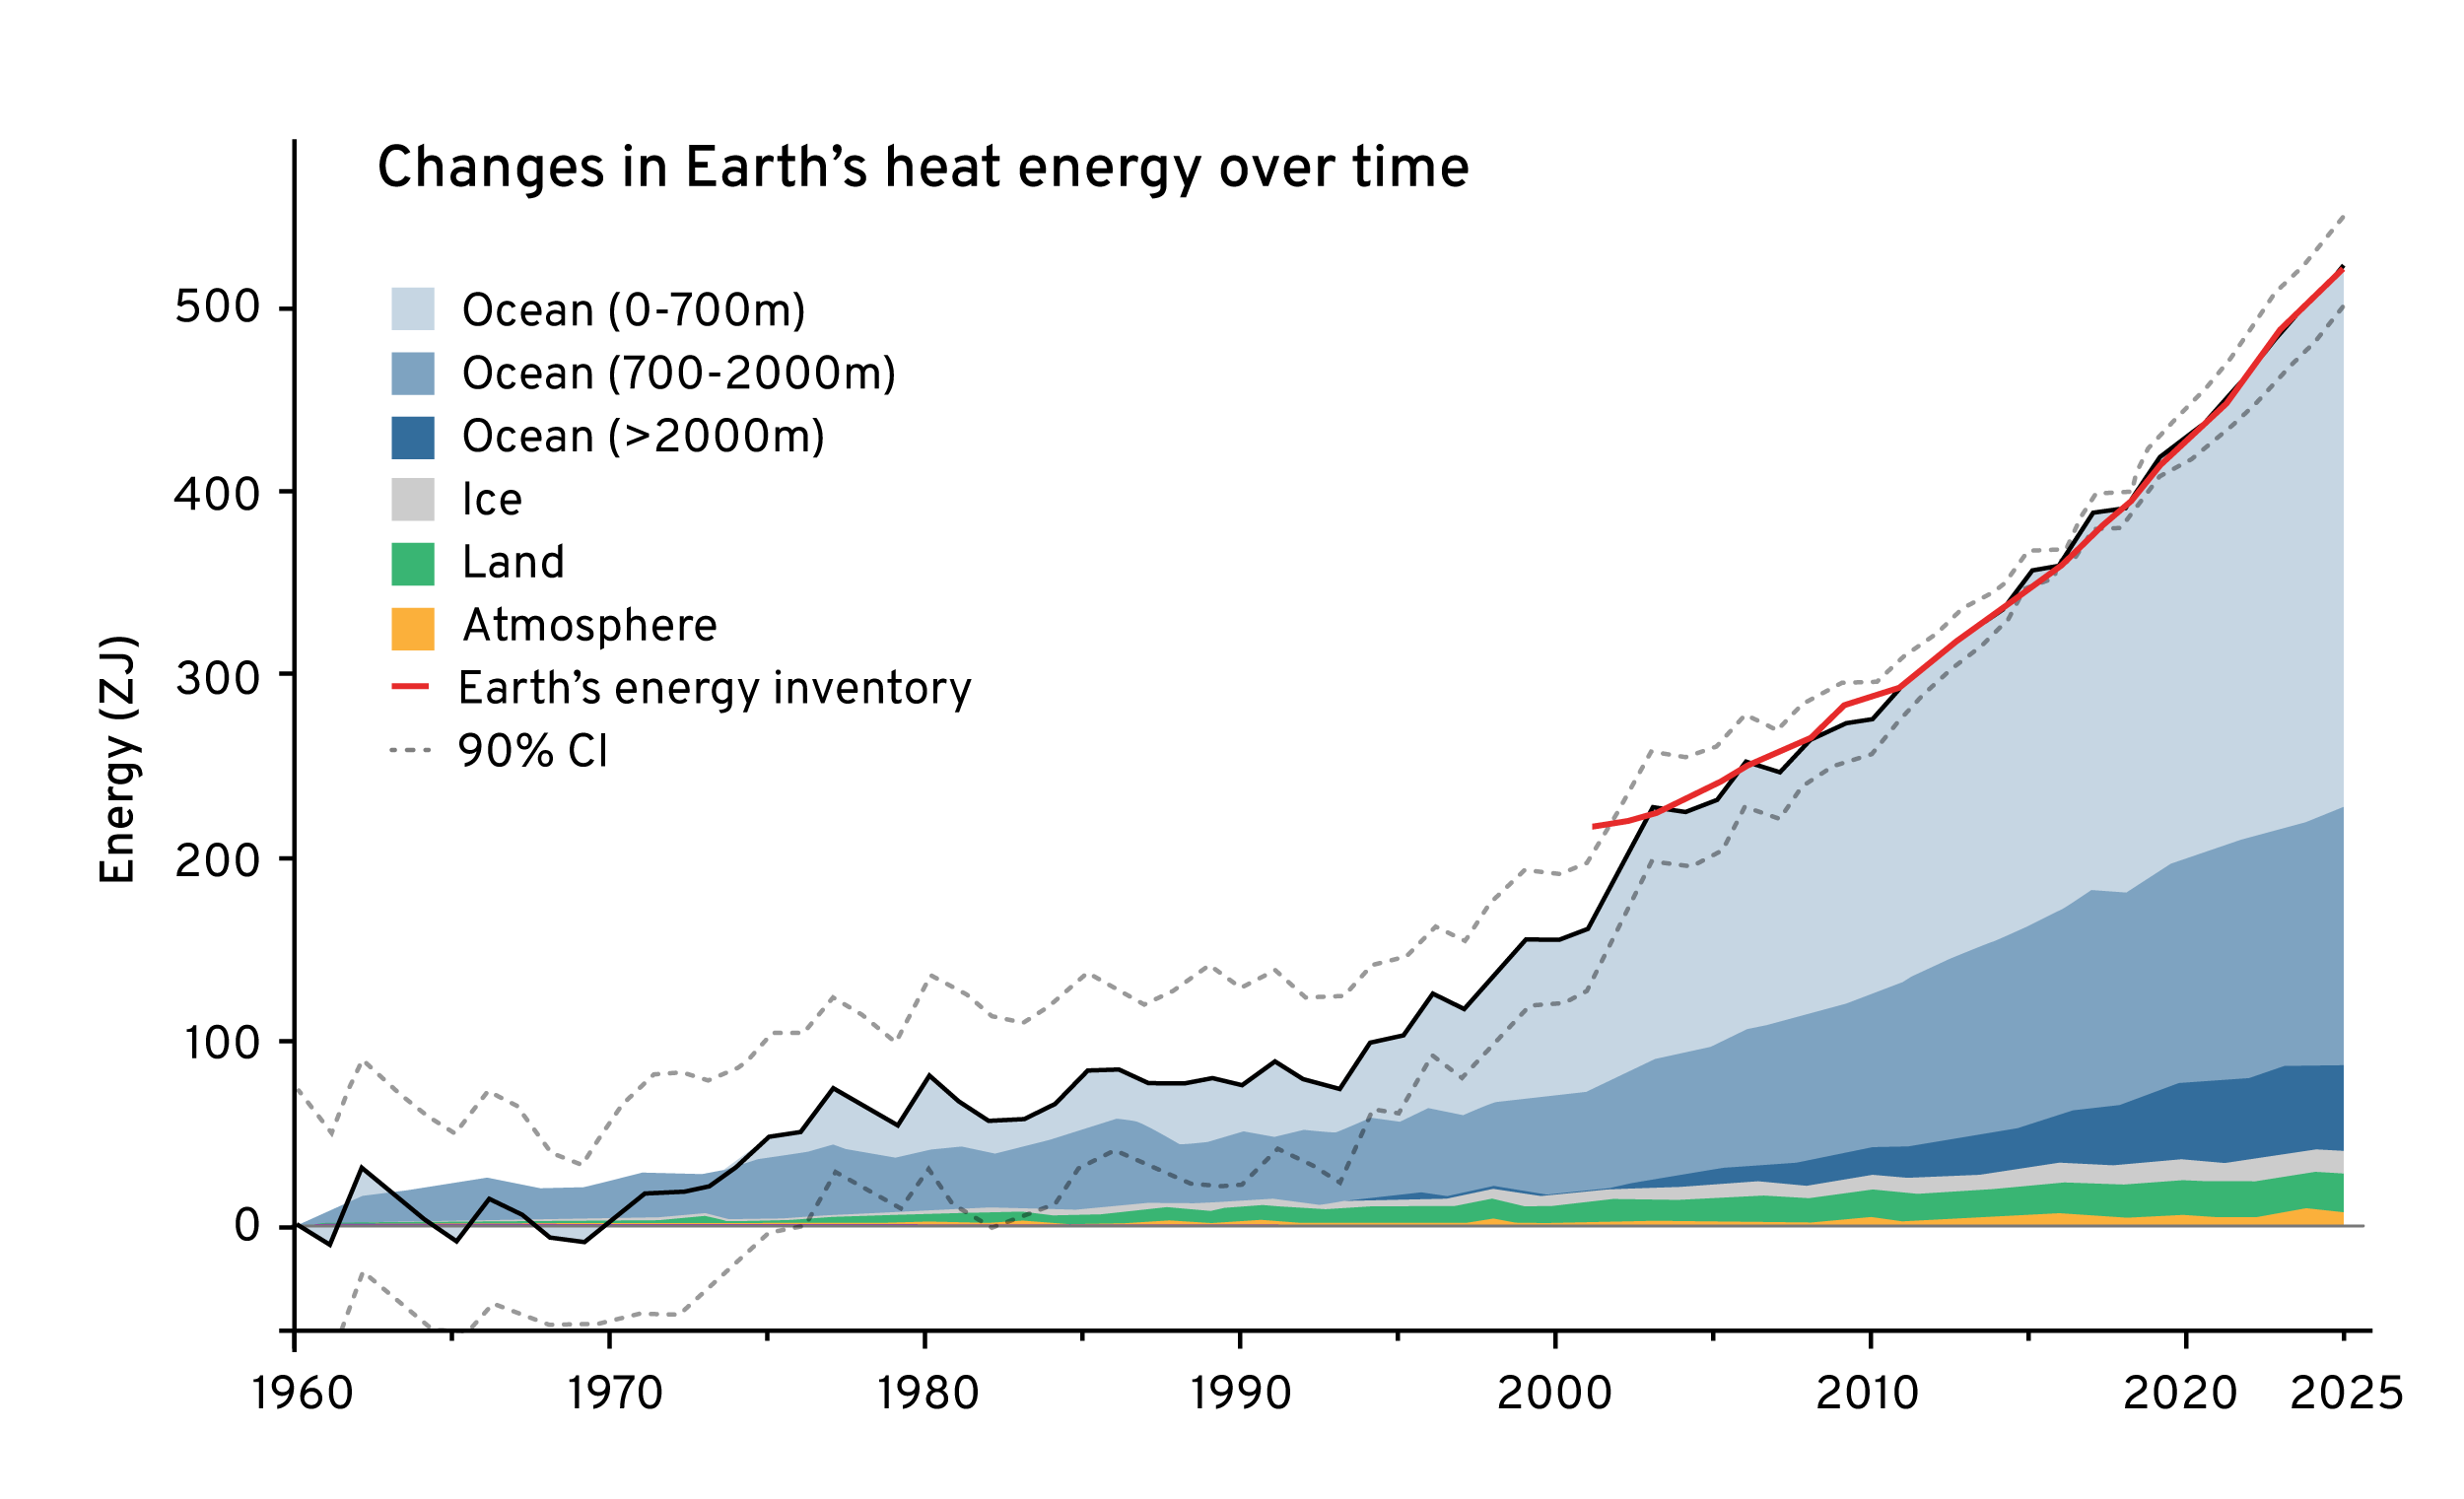
OHC annual mean time series from Institute of Atmospheric Physics (Chinese Academy of Sciences) relative to a 1958–1962 baseline, with different ocean layers shown in blue shadings and the grey dashed lines denoting the 90% confidence interval.1 Also shown are estimates of the land, ice, and atmosphere heat uptake.2 The Earth’s energy inventory (red curve) is derived by first integrating monthly Clouds and the Earth’s Radiant Energy System (CERES) EEI data in time to obtain cumulative heat uptake, then converting it to an annual series, and finally aligning the 2005–2025 baseline with that of the summed ocean, land, ice, and atmosphere heat content series. Updated from Cheng et al., 2024.3
- Bao, S., et al. (2026). Ocean heat content in 2025. Nature Reviews. Earth & Environment, 7, 206–208. ↩
- von Schuckmann, K., et al. (2023). Heat stored in the Earth system 1960–2020: Where does the energy go? Earth System Science Data, 15(4), 1675–1709. ↩
- Cheng, L., et al. (2024). IAPv4 ocean temperature and ocean heat content gridded dataset. Earth System Science Data, 16(8), 3517–3546. ↩