Key messages
- Attribution science has evolved enough to map the causal chain from emissions and emitters to the socio-economic impacts of weather events caused by climate change. This makes it possible to isolate specific harms resulting from the emissions of specific actors.
- These advances show that the emissions of “Carbon Majors” – large fossil fuel and cement producers – can be linked to ~50% of the increase in global heatwave intensity since the pre-industrial era. These emissions have already locked in substantial future impacts from climate change, such as sea level rise.
- Zooming in on the emissions arising from the consumption and investments of the wealthiest 10% shows they contributed seven times more to extreme heat than the average individual. However, the impacts disproportionately fall on low-income tropical regions.
Climate change attribution science has come a long way since it emerged as a distinct field in the 1990s. Today, it rests on three pillars. First, source attribution links past and present greenhouse gas emissions to changes in current and projected climate (Figure 7). It is, therefore, now understood that every tonne of CO₂ has a climate impact. Second, impact attribution bridges those physical changes to socio-economic outcomes, such as heat-related deaths or lost economic output. The third and most ambitious pillar, end-to-end attribution, brings these approaches together to trace a specific harm back to a specific actor’s emissions (Box 5). This Insight highlights scientific advances that connect the full causal chain from emissions to impacts.
Research has shown that direct (Scope 1) and value-chain (Scope 3) emissions from large fossil fuel and cement producers, or “Carbon Majors”, caused 24–37% of sea level rise to date, based on their activities between 1854 and 2020. Researchers have also calculated the intensity and probability of hundreds of historical extreme heat events with and without the emissions of Carbon Majors, finding these producers collectively responsible for around 50% of the increase in heatwave intensity since the industrial era (1850–1900). In fact, each Carbon Major has enough emissions to enable heatwaves that would have been virtually impossible without climate change.
Connecting physical hazards to impact models (Figure 7C, D) shows how changes in human health and economic outcomes can be attributed to climate change. A survey of 20 recent health studies found tens of thousands of deaths a year already attributed to climate change, despite covering only a limited range of health impacts. One study attributed to climate change 1,700 heat-related deaths in Zurich since 1969. Another found climate change directly caused around 6,000 deaths during the August 2003 heatwave in France.
End-to-end studies can now attribute human impacts to individual high-emitting entities directly (Figure 7A–D). Counterfactual estimates of global economic growth without Carbon Majors’ emissions show trillions of dollars in losses attributable to the largest producers. Losses are concentrated in tropical regions that are generally warmer, lower-income, and least responsible for warming. It is important to note that uncertainties compound at each step of the causal chain, often producing wide ranges of plausible local impacts. Future work will need to calculate these uncertainties meticulously and communicate conclusions with caution.
It is also becoming possible to examine the consumption and investment behaviour of high-income individuals. Simulating climate hazards with and without emissions from top income groups reveals that the wealthiest 10% increased the likelihood of extreme heat sevenfold relative to the average person, a striking contrast between consumption- and production-based accounting. Again, these attributable hazards fall disproportionately on lower-income tropical regions least responsible for warming.
Research also shows that future impacts from past emissions can substantially exceed the historical impacts of those same emissions because the warming effect of CO₂ persists for centuries. Past emissions from Carbon Majors have already committed an additional 0.26–0.55 m of sea level rise by 2300. For a pulse of CO₂ emitted in 1990, around 90% of its economic damage has yet to be realised.
Attribution science is increasingly entering the courtroom. Linking specific emitters to specific impacts can support evidence-based decision-making in climate lawsuits, many of which seek financial redress or injunctions to prevent further emissions. Attribution advances can also provide scientific grounding for polluter-pays legislation, as in certain US states, and can inform a fairer approach to international loss-and-damage negotiations.
Looking ahead, challenges remain for attribution science. Most studies focus on extreme heat and sea level rise because of clearer links to emissions; other hazards, such as floods, droughts, and tropical cyclones, remain challenging to assess and are understudied. Simpler methods that use the near-linear relationship between cumulative CO₂ emissions and global temperatures can attribute impacts to individual emission sources, e.g., the warming contribution of individual fossil fuel projects. However, these methods cannot capture nonlinearities or time lags, and some processes, such as those involving aerosols, require alternative approaches.
Another limitation is that most attribution analyses have concentrated on high-income regions while data scarcity persists in low- and middle-income countries. Systematic attribution methods may expand coverage, but disaster databases remain globally incomplete. Notably, most health attribution studies focus on high-income countries, despite disproportionate burdens elsewhere, partly because epidemiological models require high-resolution data that are not globally available.
Despite these challenges, attribution science increasingly provides robust evidence to inform decision-making, legal questions, and climate negotiations. It cannot resolve normative or political questions, but it sharpens understanding of the physical evidence underpinning them. Future work will further extend end-to-end attribution, move beyond temperature-related impacts, broaden geographical coverage, and improve coordination across research communities.
Box 5. End-to-end attribution: The holy grail
In 1997, Brazil proposed assigning climate mitigation obligations based on countries’ historical responsibility for warming, spurring scientists to link national emissions to global temperature rise. Two decades of attribution research have built on that foundation: first connecting emissions to physical climate change, then extending to specific emitters such as fossil fuel producers and to metrics like sea level rise and extreme weather, before linking that physical change to socio-economic harm. The next step, now within reach, is to trace the full causal chain.
Example: Connecting a specific fossil fuel producer to rising global temperatures, to local heat extremes, and then to economic damages.
End-to-end attribution studies compare two versions of the world: the factual, the world as it actually is, and the counterfactual, a simulated world in which everything else stays the same but a specific actor’s emissions never existed. The gap between the two reveals the climate change and harm attributable to that actor (Figure 7A, B). The field also exposes the disproportionate burden low-income regions bear despite contributing the least to warming, while often lacking the data to document their own losses.
Policy implications
- Build open, locally led attribution capacity. UNFCCC bodies and the Parties should invest in public climate observations, disaster-loss databases, socio-economic data and locally led modelling institutions, particularly in vulnerable low-income countries. Together, these bodies should support open tools, regional research hubs, and sustained training.
- At COP31, the Paris Committee on Capacity-building, which identifies and coordinates responses to capacity gaps, should convene technical partnerships; the Santiago Network should provide country-requested assistance; and the Warsaw International Mechanism should compile methods, data standards, and good practices.
- Use attribution to inform, not condition, loss and damage funding. The FRLD and its funders should use attribution evidence to improve loss assessments, needs estimates, and project design ahead of its first replenishment process in 2027. However, attribution should not be a condition of support. Funding should remain based primarily on vulnerability and need because unequal observational data and modelling capacity could otherwise exclude those least equipped to produce complex evidence.
- Integrate attribution evidence into law, regulation, and policy design. National legislatures and regulators can use attribution evidence when designing polluter-pays levies, climate-damage funds, corporate disclosure requirements, and permitting rules; courts can consider it when assessing causation under applicable law. However, scientific estimates alone do not determine legal breach, liability, or compensation. These questions should generally be addressed through domestic and international law outside the UNFCCC.
- The International Court of Justice’s 2025 advisory opinion on Obligations of States in Respect of Climate Change clarified states’ duties of due diligence and cooperation, finding that a state’s failure to take appropriate action to avoid climate change may constitute an internationally wrongful act under international law.
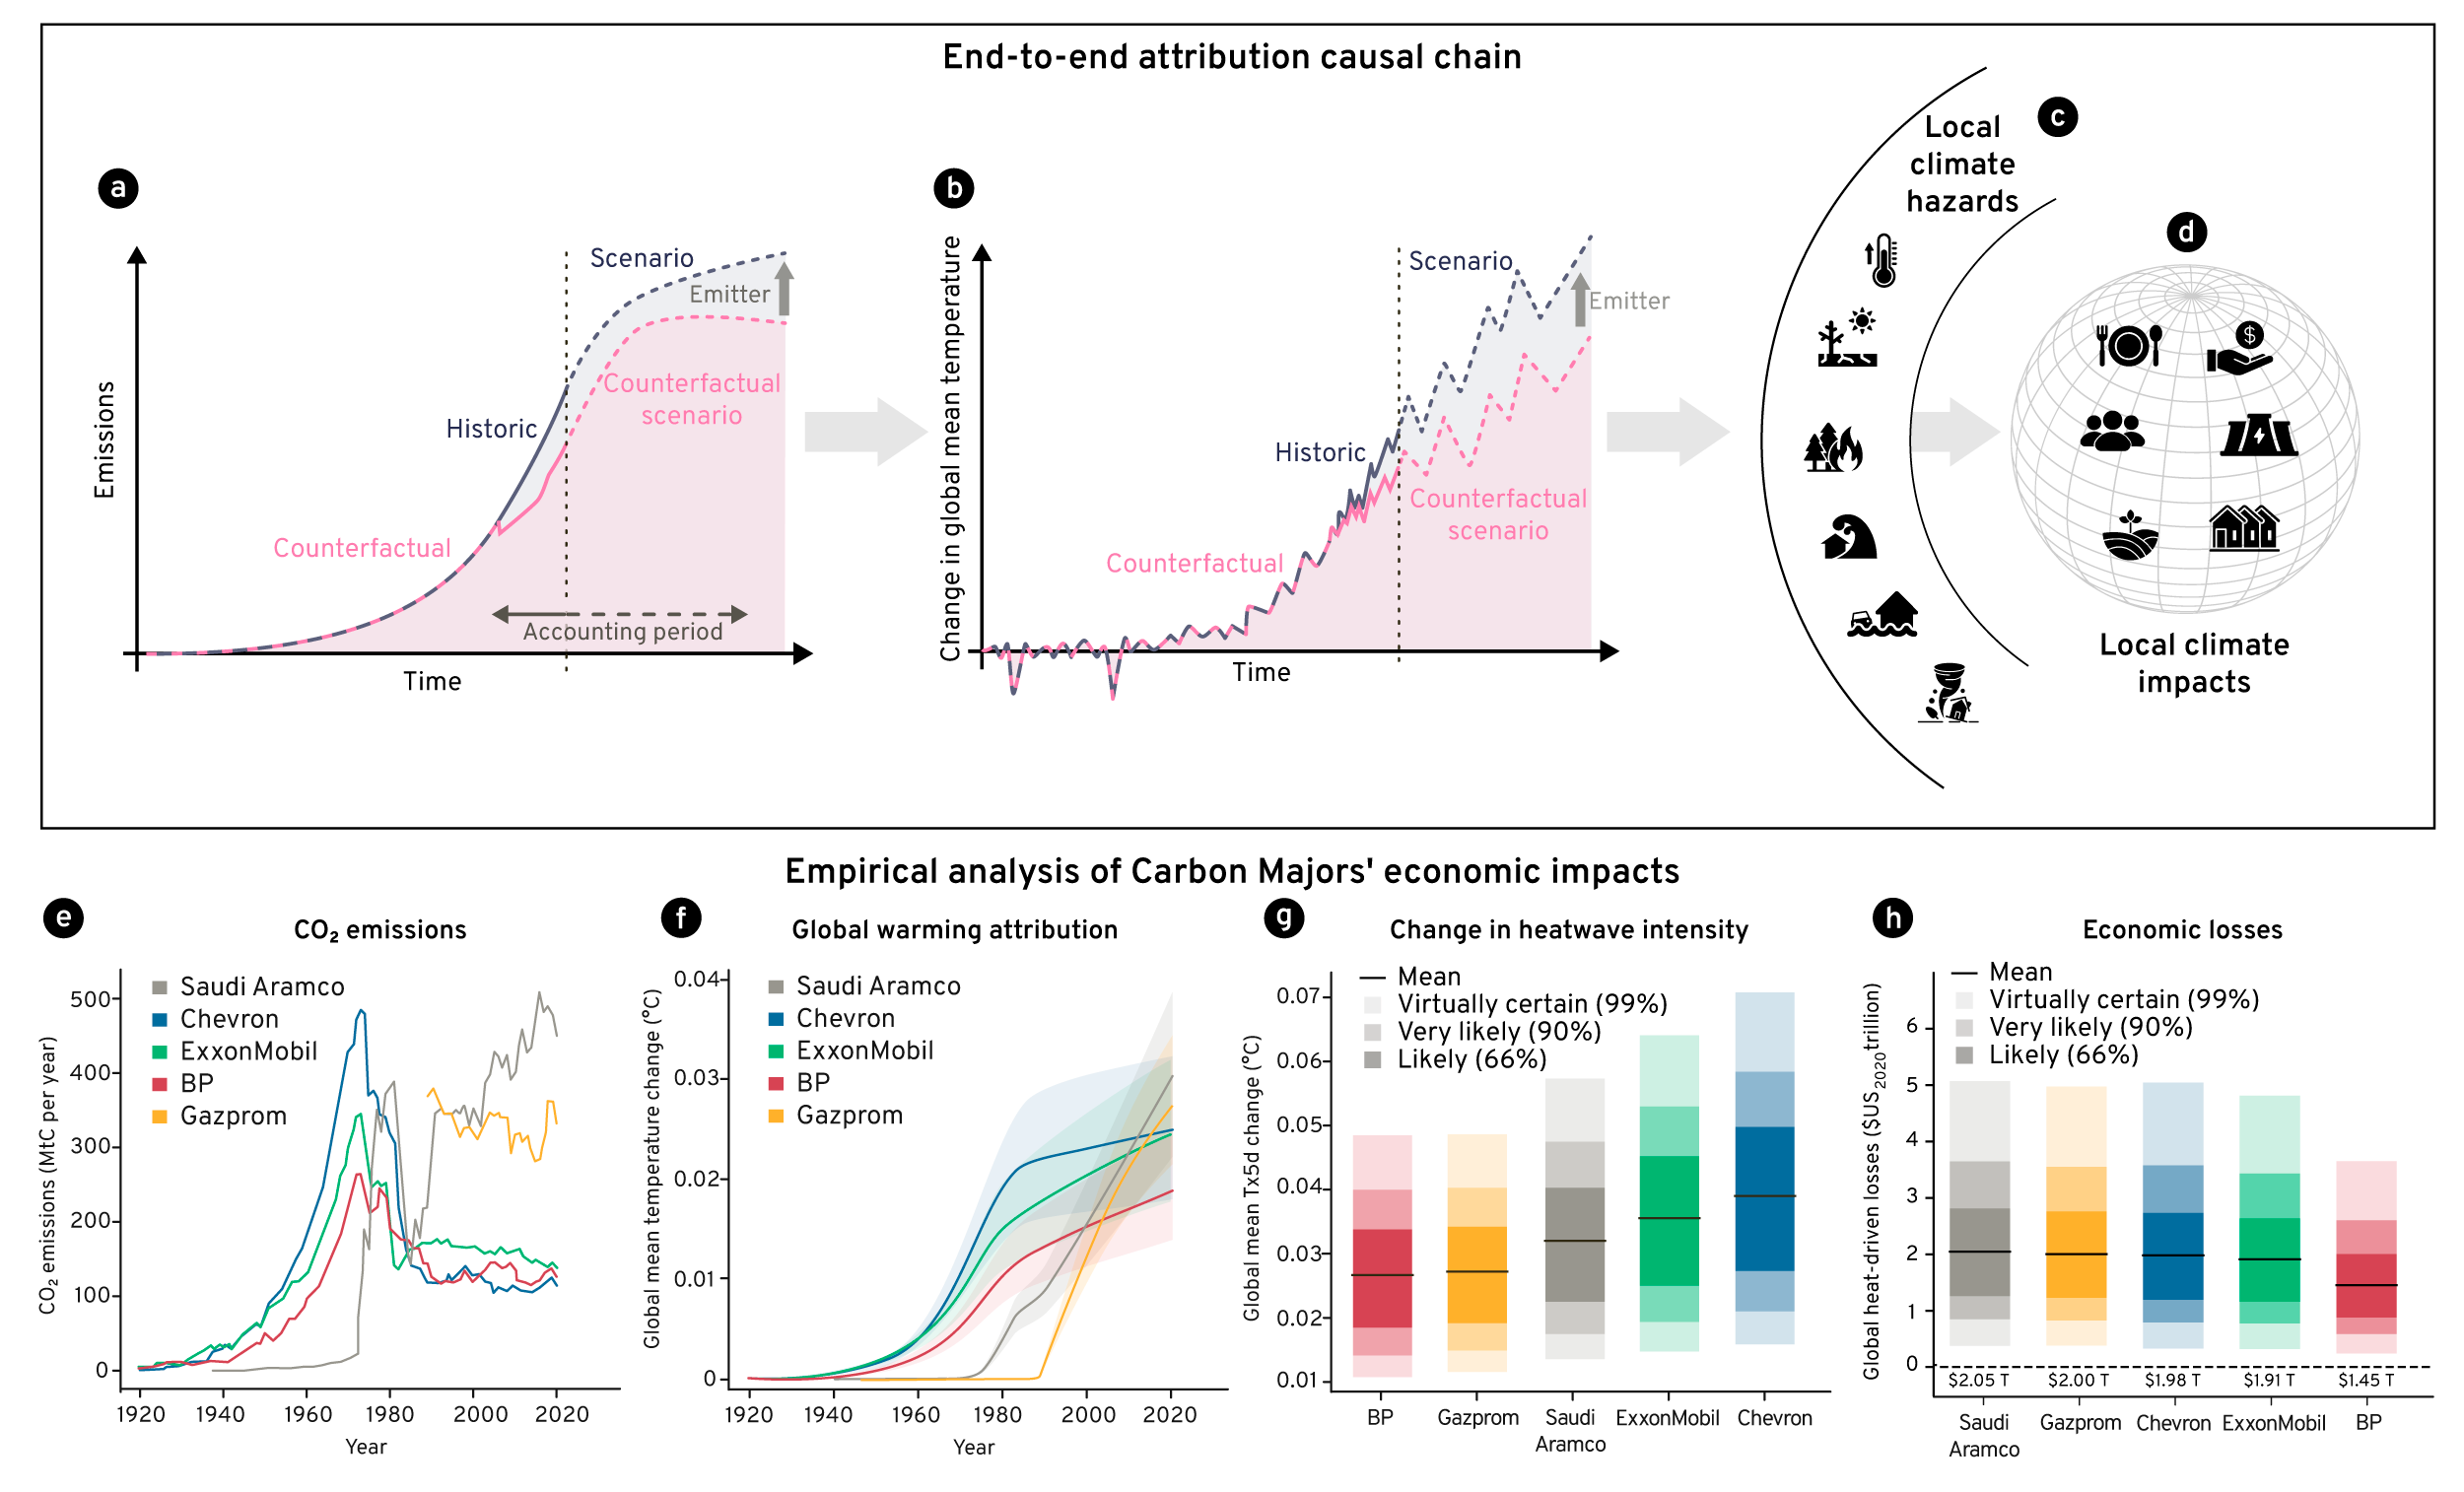
Top panel: Source attribution links specific emissions (a) to changes in the global climate (b) and local climate hazards (c). Impact attribution links the global climate (b) to local climate hazards (c) and local climate impacts (d). End-to-end attribution connects the whole causal chain. Bottom panels (modified from Callahan & Mankin, 2025)1 show: CO₂ emissions from the top five emitting fossil fuel companies (“Carbon Majors”) (e); global warming magnitude attributable to cumulative emissions from each Carbon Major (shading shows the 90% likelihood range across the simulation) (f); changes in the average temperature of the five hottest days each year (1991–2020) attributable to each carbon major (g); and cumulative global heat-driven economic losses attributable to the five largest fossil fuel emitters (h). Lines show the mean, and shading indicates uncertainty ranges.
- Callahan, C. W., & Mankin, J. S. (2025). Carbon majors and the scientific case for climate liability. Nature, 640(8060), 893–901. ↩